


As we enter the second quarter of 2023, we take a look at historical trends to provide perspective on current events. Our first quarter perspectives looks at job growth beating expectations, inflation improvements and reasons for concern, market volatility, and consequences of trying to time the market.
Job growth remains persistently strong
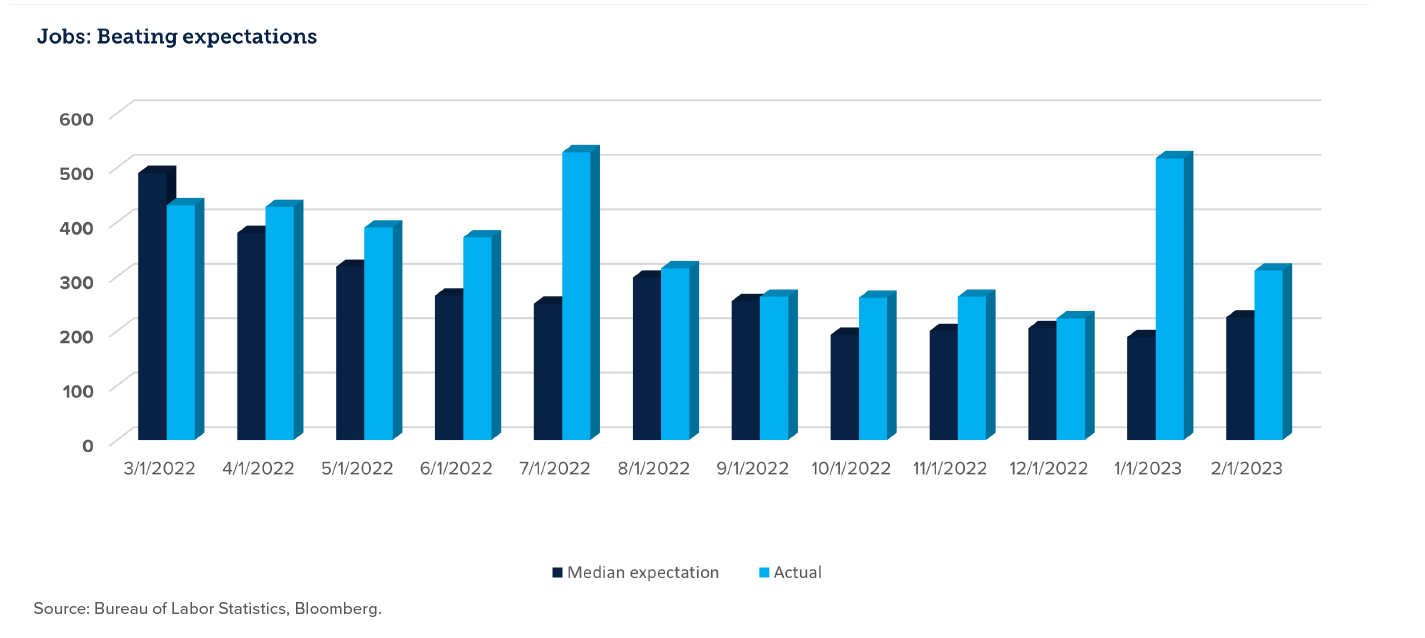
- Recent jobs reports highlight solid gains in employment, with actual growth numbers outpacing analysts’ expectations.
- A strong labor market could help lessen any recessionary impacts.
- Labor force participation rates are slowly returning to pre-pandemic levels but open jobs continue to outpace labor supply gains.
- Tight labor market conditions will continue to add inflationary pressures.
- Deterioration of job growth could cause Fed to slow restrictive policies.
Inflation improving but remains a concern
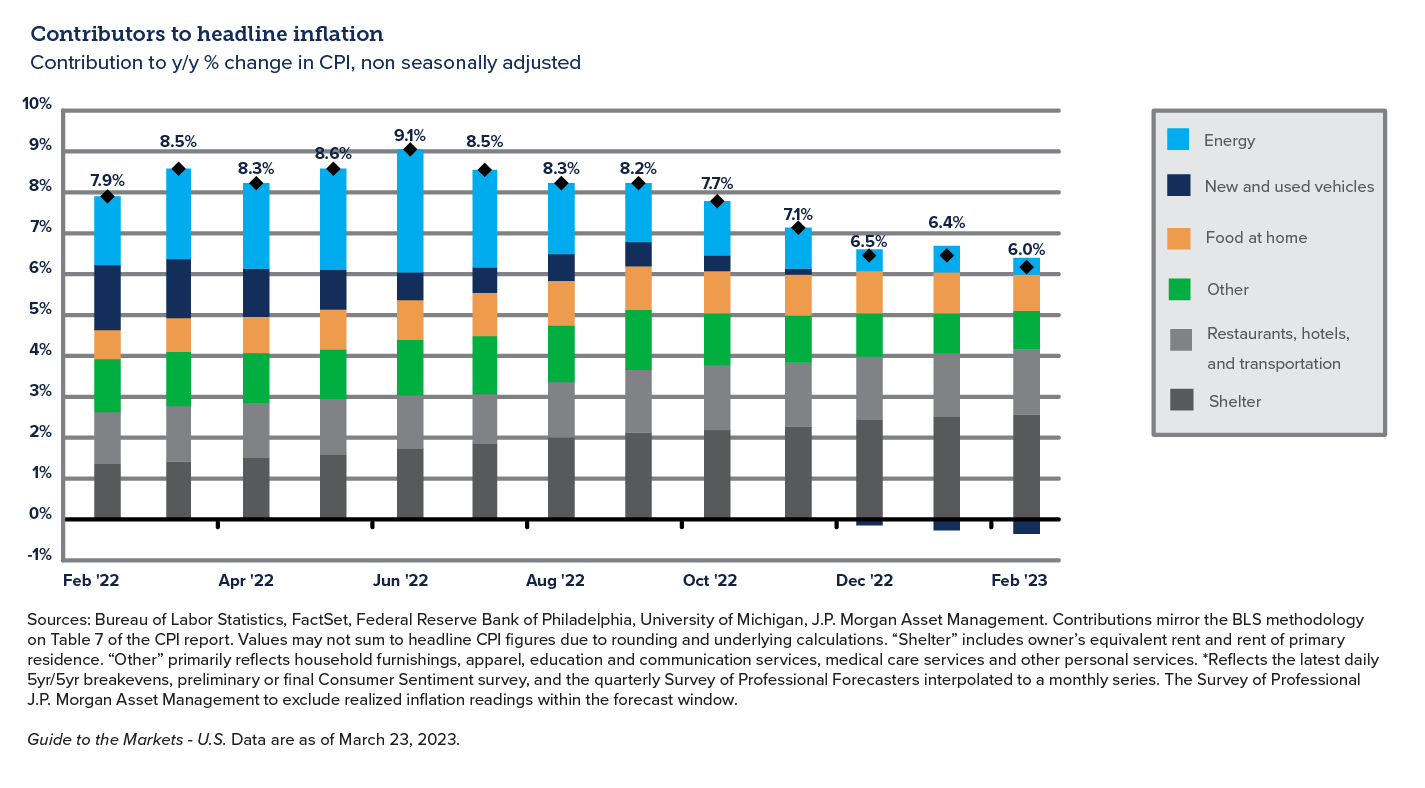
- Headline inflation has shown a steady drop each month since June 2022.
- Largest contributors to current inflation are shelter and labor, which tend to take longer to correct.
- Vehicle prices likely affected by recent increase in borrowing costs and supply chain improvements.
- Food prices continue to be affected by non-economic factors such as weather and geopolitical turmoil.
- Fed remains committed to reaching their long-term target of 2%.
Market volatility is always present, even in the good years
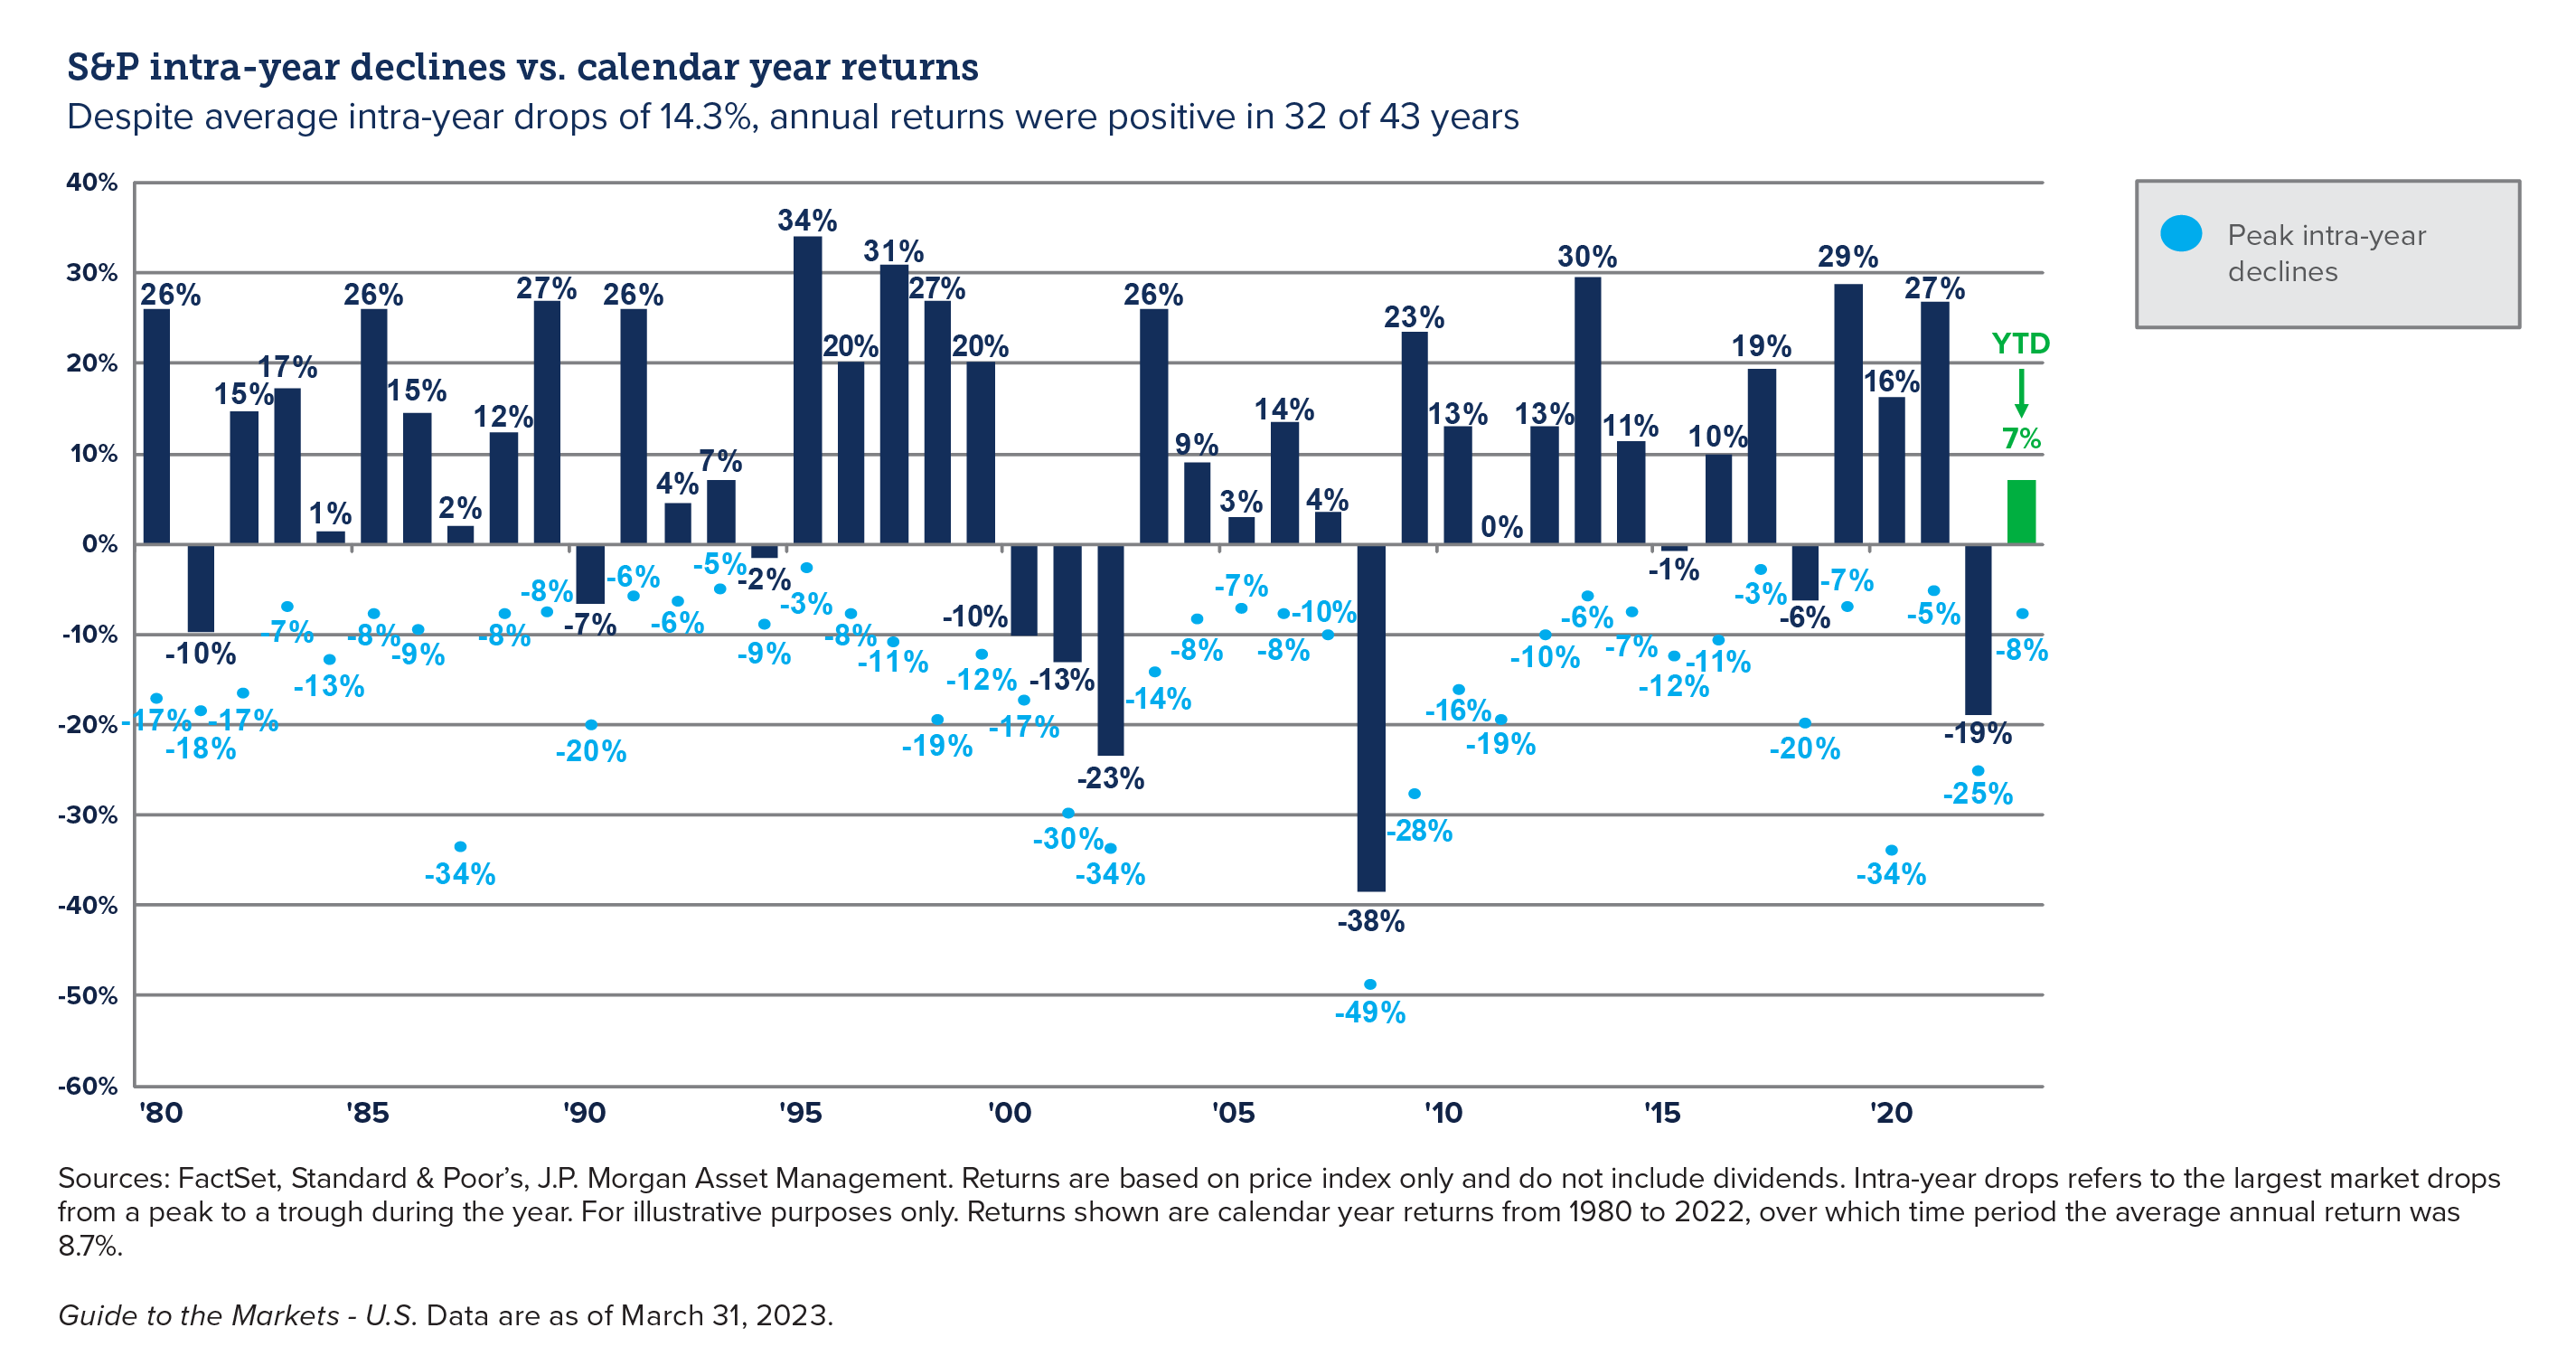
- Short-term market volatility is heavily influenced by negative headlines – such as geopolitical conflicts or financial crisis – but the effects tend to be short-lived.
- Despite average intra-year drops of 14.3%, annual returns were positive in 32 of 43 years.
- On average, the S&P experienced an intra-year drop of 15% or more every 2.5 years.
- The market has experienced a 20% or more drop in 3 of the last 5 years, but has returned an annualized 9.4% over the same time period.
Trying to time the market rarely works
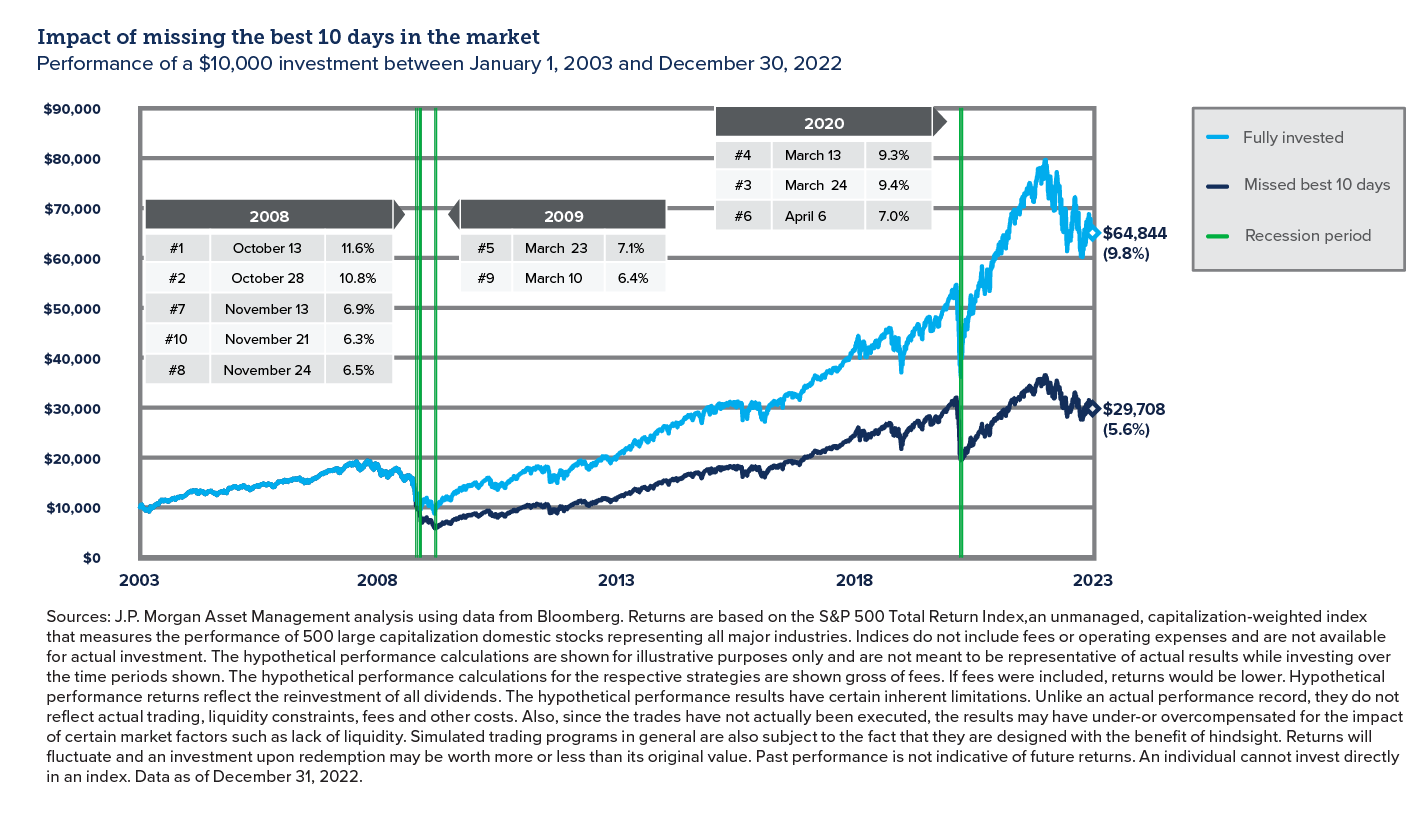
- In the past 20 years, all 10 of the best days occurred during a crisis.
- Best and worst days tend to occur together.
- Seven of the 10 best days occurred within two weeks of the 10 worst days.
- The second worst day of 2020 (March 12th) was immediately followed by the second best day of 2020 (March 13th).
The INTRUST Quarterly Perspectives are the consensus of the INTRUST Investment Strategy team and are based on third-party sources believed to be reliable. INTRUST has relied upon and assumed, without independent verification, the accuracy and completeness of this third-party information.
INTRUST makes no warranties with regard to the information or results obtained by its use and disclaims any and all liability arising out of the use of, or reliance on, the information.
The information presented has been prepared for informational purposes only. It should not be relied upon as a recommendation to buy or sell securities or to participate in any investment strategy. The Quarterly Perspectives are not intended to, and should not, form a primary basis for any investment decisions. This information should not be construed as investment, legal, tax or accounting advice. Past performance is no guarantee of future results.
| Not FDIC Insured | No Bank Guarantee | May Lose Value |
Posted:
04/12/2023
Category:
Recommended Articles
